How to use Log Analytics to Detect Log Anomaly?


Audio : Listen to This Blog.
INTRODUCTION
We’ll focus on the problem of detecting anomalies in application run-time behaviors from their execution logs.
Log Template usage can be broadly classified to determine:
- The log occurrence counts [include error, info, debug and others] from the specific software components or software package or modules.
- The cause for the application anomalies, which includes a certain software component(s), actual hardware resource or its associated tasks.
- The software components or software package or modules, which are “most utilized “or “least utilized”. This helps to tweak the application performance, by focusing on the most utilized modules.
This new technique helps to:
- Overcome the instrumentation requirements or application specific assumptions made in prior log mining approaches.
- Improve by orders of magnitude the capability of the log mining process in terms of volume of log data that can be processed per day.
BENEFITS OF THIS SOLUTION:
- Product Engineering Team can effectively utilize this solution across several of its products for monitoring and improving the product functional stability and performance.
- This solution will help detect the application abnormalities in advance and alert the administrator to take corrective actions and prevent application outage.
- This solution tries to preserve the application logs and anomalies. This can be effectively utilized for improving the operation efficiency by,
- System Integrator
- Application Administrator(s)
- Site Reliability Engineer(s)
- Quality Assurance Ops Engineer(s)
SOLUTION ARCHITECTURE:
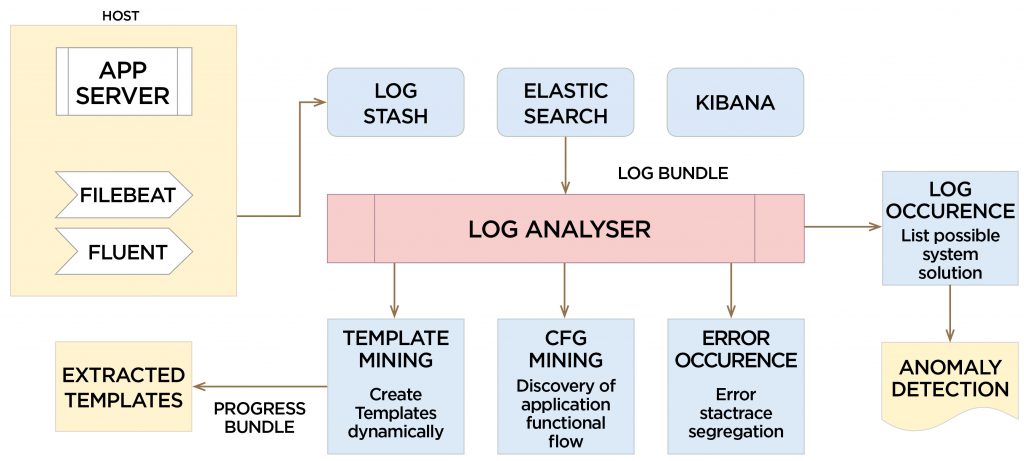
ELK Stack (Elasticsearch, Logstash, and Kibana) is the most popular open source log analysis platform. ELK is quickly overtaking existing proprietary solutions and has become the first choice for companies shipping for log analysis and management solutions.
ELK stack is comprised of three separate yet alike open-source products:
- Elasticsearch, which is based on Apache Lucene is a full-text search engine to perform full-text and other complex searches.
- Logstash processes the data before sending it to Elasticsearch for indexing and storage.
- Kibana is the visualization tool that enables you to view log messages and create graphs and visualizations.
Filebeat
Installed on a client that will continue to push their logs to Logstash, Filebeat serves as a log shipping agent that utilizes the lumberjack networking protocol to communicate with Logstash. ELK Stack along with Filebeat preserves the application logs as long as we want. These pre-served application logs can be used for log template mining, further triaging to find evidence of the application malfunctioning or anomalies observed.
TECHNOLOGIES:
- Python 3.6, NumPy, Matplotlib, Plotly, and Pandas modules.
HIGH LEVEL APPROACHES:
- Log Transformation Phase: Transformation of logs [unstructured data] into structured data to categorize the log message into the below-mentioned dimensions and facts.
- Dimension:
- Time Dimension [ Year, Month, Date, Hour, Min, Second]
- Application Dimension [ Thread Name, Class Name, Log Template, Dynamic Parameter, and its combinations.
- Fact: Custom Log Message
- Dimension:
- Log Template Mining Phase: Log mining process consumes the “Custom Log Message” to discover the Log Templates and enable the analytics in any or all of the dimensions as mentioned above.
- Log Template Prediction Phase: In addition to the discovery of Log Template pattern, log mining process also helps to predict the relevant log template for the received “Custom Log Message”.
LOG TRANSFORMATION PHASE:
LOG PARSING:
- Unstructured Record — Structured Record :
- Creation of Dimension Table for preserving Time and Application dimension details.
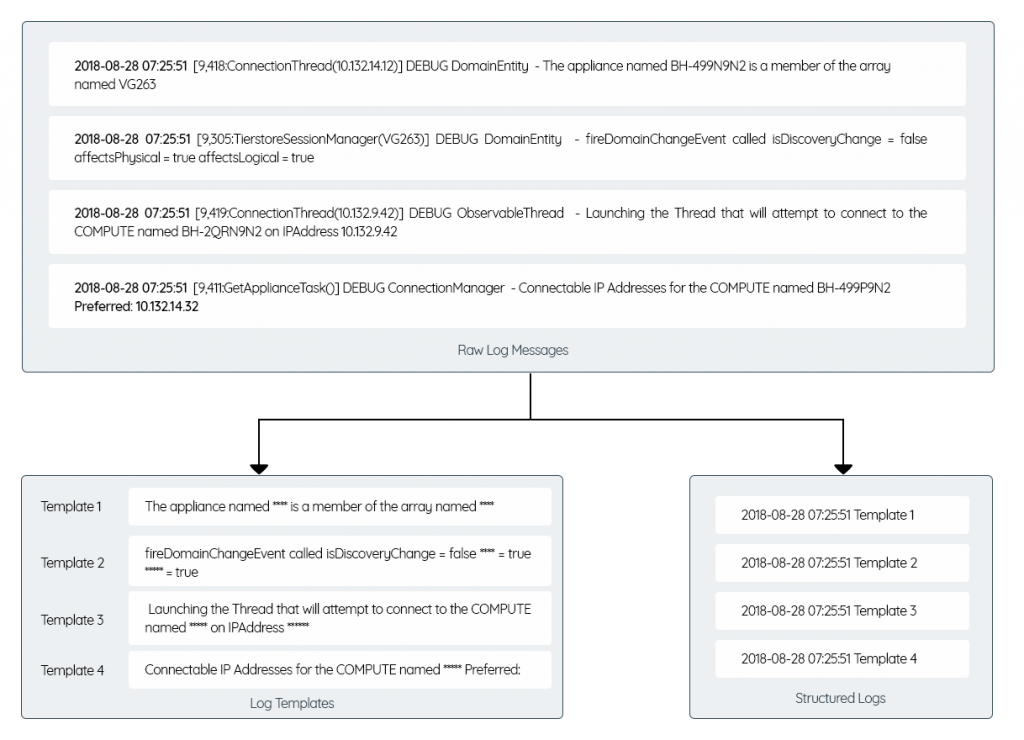
LOG TEMPLATE MINING PHASE:
- Individual log lines are compared against other log lines to identify the common as well as unique word appearance etc.
- Log Template Generations are accomplished by following the below mentioned steps:
- Log Lines Clustering: Clustering the log lines, which are closely matching w.r.t common words and its ordering.
- Unique Word Collection: identifying and collecting unique words within clusters
- Unique Word Masking: Masking one of the randomly selected log line and using the result log line as Log Template.
- Log Template Validation: Applying log template to all the clustered log lines to extract the unique words and ensuring that those words are unique.
- Dynamic Parameter Extraction: Applying log template to all the clustered log lines and extracting and persisting dynamic parameter(s) are against each log lines.
LOG TEMPLATE PREDICTION PHASE:
- Log Lines Cluster Identification: Identifying log line common words and unique word b/w Log Template and Custom Log Message.
- Log Template Identification: Selecting a closely matched Log Template as Log Template and extracting unique or dynamic parameters using the selected Log Template.
- Log Template Generation: Triggering process, in case if no log template are closely matching.
- Dynamic Parameter Extraction: Extracting applied log template to all the clustered log lines and dynamic parameter(s) and persisting them against each log lines.
- Log Template Persistence:
- Processing the received real-time log line and found the log template match from the Log Template Inventory.
- Processing and updating the Inventory Log Template based on the received real-time log line.
- Processing and creating the new Log Template from the received real-time log line and updating the Inventory Log Template.
ANOMALIES DETECTION PHASE:
- Identifying application anomalies through the
- Detection of the spike in total log records, error records received on the particular moment [date & time scale].
- Detection of the spike in processing time.i.e. time difference between the subsequent log records on the particular moment [date & time scale].
- Detection of the spike in few application threads emitting large number of log records for the particular moment [date & time scale].
- Registering of the administrator with the system to receive asynchronous notification about the anomalies either through E-Mail or SMS etc.
- Persisting anomalies details in a distributed database like Cassandra Database with the aggregated information like
- Spike in total log records, error records count on the specific time
- Spike in processing time on the specific time
- Application threads which emitted a large number of log records on the specific
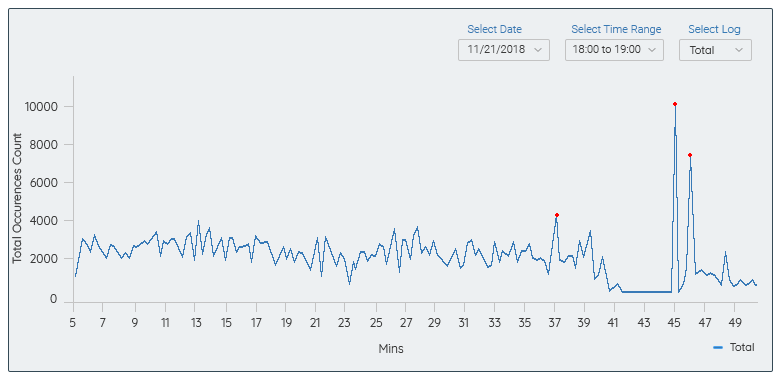
ANOMALIES DETECTION USING LOGS COUNT:
- Plott the line graph using the time-scale to depict the number of log line occurrences
- Generate the same report for error log records too.
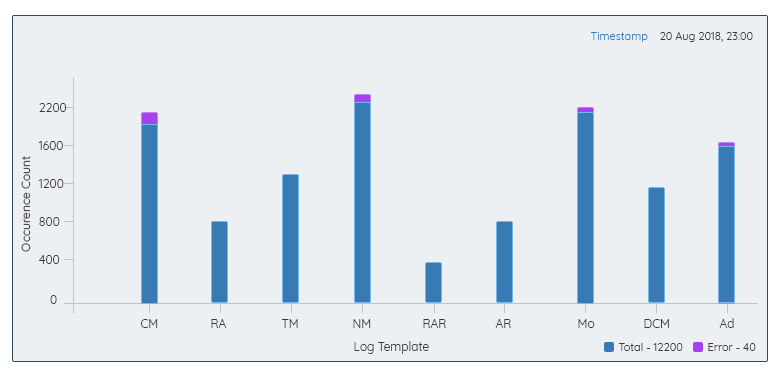
ANOMALIES SPOT LOG RECORD COUNT:
- Bar Graph can be used to show the significant contribution by the several log templates, which causes the anomalies.
- This graph can be launched by clicking on the anomalies point presented from the logs count report.
ROOT CAUSE [ACTUAL RESOURCE, SOFTWARE COMPONENT] FOR ANOMALIES POINT:
- The report will be generated for the selected Log Template.
- This report can be launched by clicking on the Log Template Occurrence Report for a particular Log Template, where the significant contribution found for anomalies.
![ROOT CAUSE [ACTUAL RESOURCE, SOFTWARE COMPONENT] FOR ANOMALIES POINT](https://msystechnologies.com/wp-content/uploads/2019/03/5-1024x545.png)
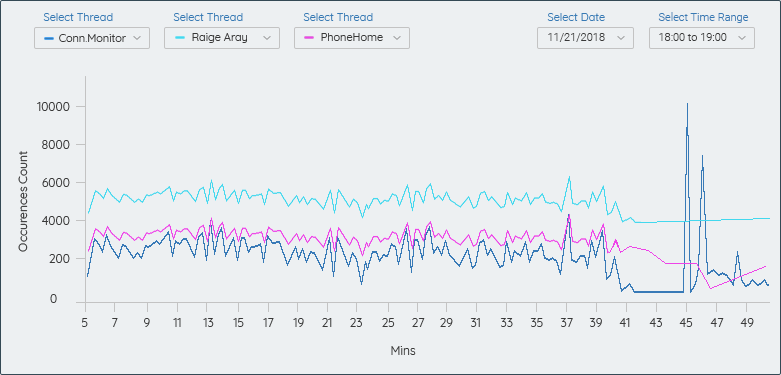
ANOMALIES DETECTION BASED ON THREAD
- Line Graph can be used to show the significant contribution by the different threads, which causes the anomalies.
ANOMALIES DETECTION BASED ON PROCESSING TIME B/W LOGS RECORD ENTRY TIME:
- Line Graph can be used to depict the cumulative processing time b/w log line
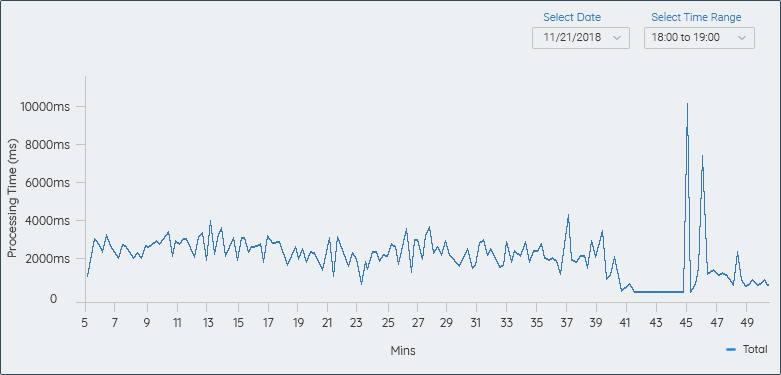
[includes regular logs as well as error logs]
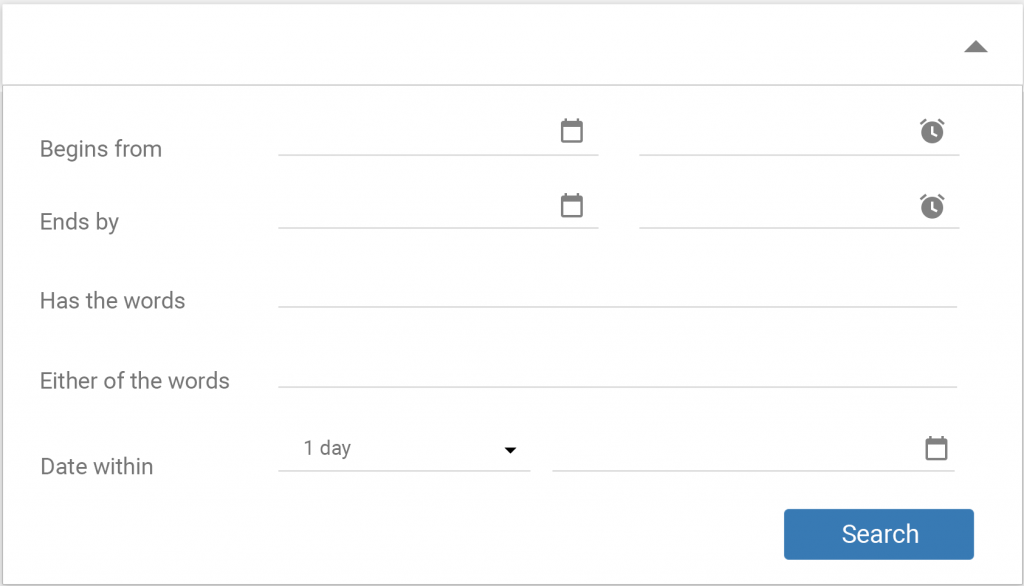
ANOMALIES ROOT CAUSE ANALYSIS BY SEARCHING & FILTERING FROM RAW LOG RECORD:
- GUI presents about the list of unique words [which represents the actual resources used by the application] extracted from the Log Record to construct the Log Template.
- Searching the log record b/w specific time frame for the specific keyword or set of keywords [must be one among the unique words found during the Log Template Mining Phase] with AND or OR condition.
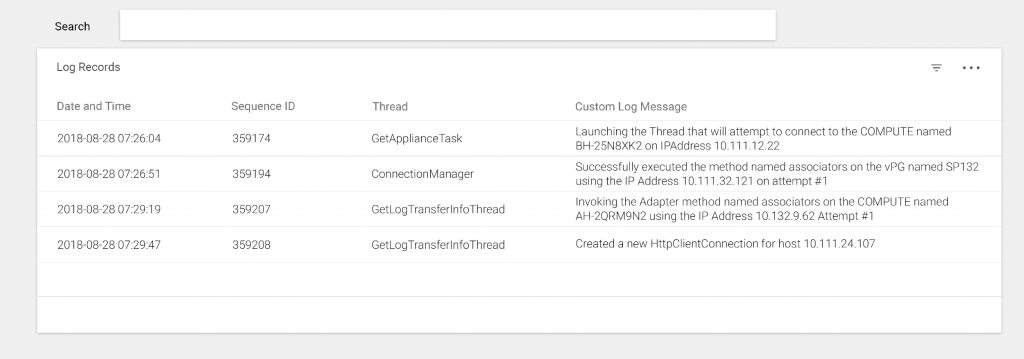
- Log Record Search result presents the table with the following sortable columns [ single or multiple column sorting ] :
- Date Time
- Log Sequence ID
- Thread
- Custom Log Message [ with the highlighted search keywords]
SEARCH FORM:
SEARCH RESULT:
CONCLUSION
So far, this solution presents the various steps, which can be collectively used to analyze the logs and identify the anomalies in the application, as well as the resource(s) causing those anomalies.
Detection of following cases can be considered as an anomaly for an application
- Request timeout or zero requests processing time i.e. application hung or deadlock.
- Prolonged, consistent increase in processing time.
- Heavy and constant increase in application memory usage.
5.1 DIRECTIONS FOR FUTURE DEVELOPMENT
This solution can be further extended to analyze the control flow as a whole, using control flow graph mining. This control flow mining helps to detect or determine the application anomalies by detecting the following cases:
- Deviation from the recorded functional flow.
- Most and least accessed or utilized functions and the resource associated.
- Cumulative processing time per control flow, by associated resources.
- The number of active control flow for a given moment of time on a real-time basis.
- Control flow graph classification based on the cumulative processing time.
REFERENCES
- Anomaly Detection Using Program Control Flow Graph Mining from Execution Logs by Animesh Nandi, Atri Mandal, Shubham Atreja, Gargi B. Dasgupta, Subhrajit Bhattacharya, IBM Research, IIT Kanpur, 2016.
- An Evaluation Study on Log Parsing and Its Use in Log Mining by Pinjia He, Jieming Zhu, Shilin He, Jian Li, and Michael R. Lyu, Department of Computer Science and Engineering, 2016